This is the case of a sampled function F(x1,x2,x3), with each sample returning a scalar. This area is sometimes called Volume Visualization.
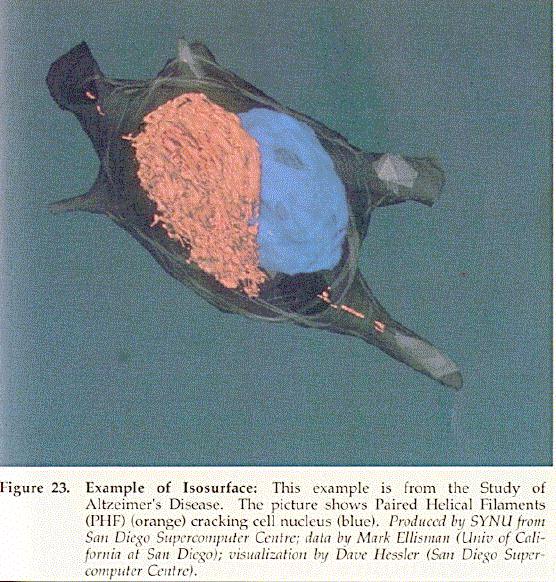
| This is similar to contour lines for the 2D case, but now a new surface of constant values is generated. | |
| Color and partial opacity are assigned to each voxel by some method. The final pixel value is obtained by summing the appropriate voxel values. An example of volume rendering. | 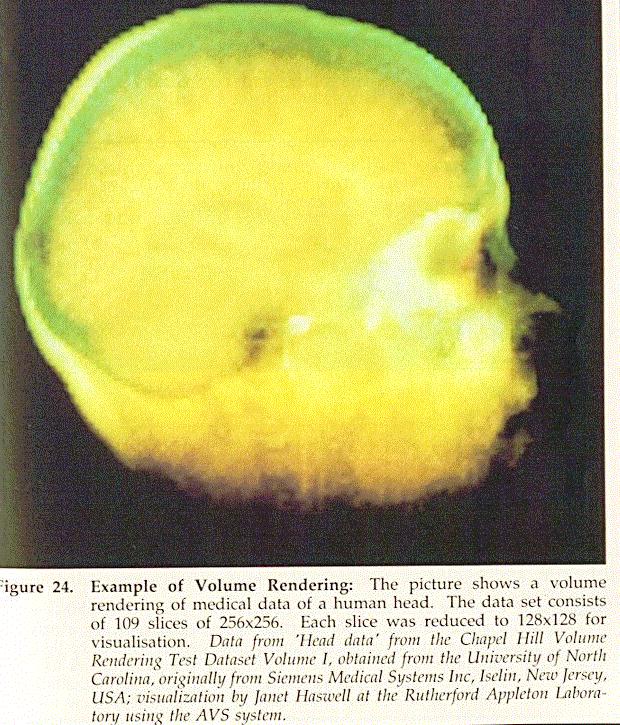 |
![]()
![]() Visualization
Techniques for Data Display
Visualization
Techniques for Data Display
![]() HyperVis Table of
Contents
HyperVis Table of
Contents