Data Classification for Volume Visualization
- Surface-fitting:
- User Picks Threshold Value
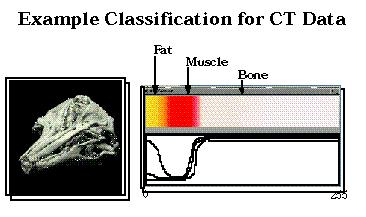
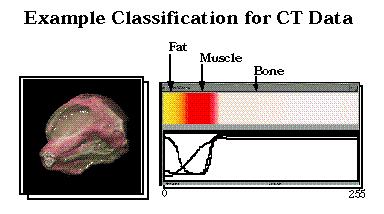
- Direct Volume Rendering::
- User Specifies Color Table Map Data Values to Meaningful Colors
- User Specifies Opacity Table Map Interesting Data to Opaque
- Map Other Data to Transparent
Setting up the Tables

 Back to DVR Algorithms
 HyperVis Table
of Contents
HyperVis Table
of Contents
Last modified on February 16, 1999, G.
Scott Owen, owen@siggraph.org