Rosalee Wolfe
DePaul University
wolfe@cs.depaul.edu
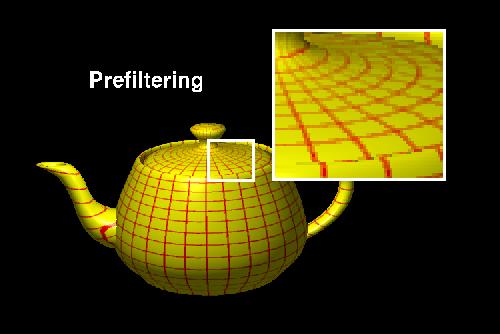
| 69: Prefiltering in action | |
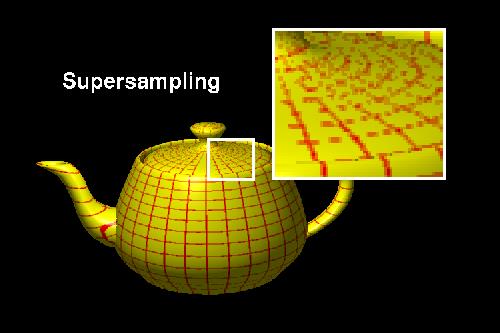
| 70: Supersampling in action. | |
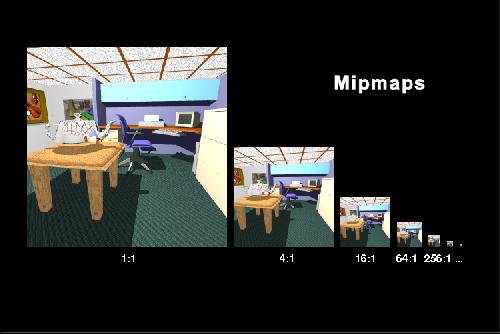
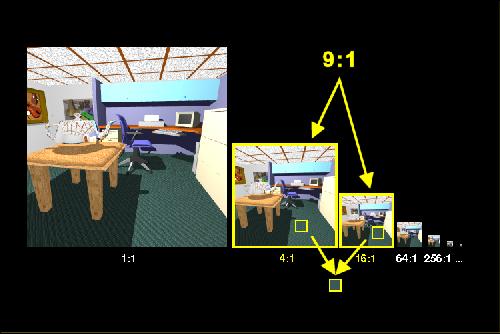
| 71: Antialiasing is expensive due to the additional computation required to compute an average color. Mipmapping saves some expense by precalculating some average colors (Williams, 1983). The mipmap algorithm first creates several versions of the texture. Beginning with the original texture the mipmap algorithm computes a new texture that’s one fourth the size. In the new, smaller texture map, each pixel contains the average of four pixels from the original texture. The process of creating smaller images continues until we get a texture map containing one pixel. That one pixel contains the average color of the original texture map in its entirety. | |
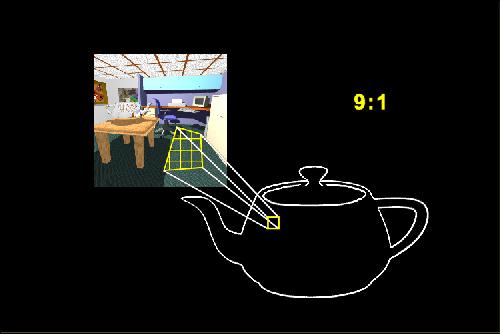
| 72: In the texture mapping phase the area of each pixel on the object is mapped into the original texture map. The mipmap computes a measure of how many texture pixels are in the area defined by the mapped pixel. In this example approximately nine texture pixels will influence the final color so the ratio of texture pixels to object pixel is 9:1. | |
| 73: To compute the final color, we find the two texture maps whose ratios of texture pixels are closest to the ratio for the current object pixel. We look up the pixel colors in these two maps and average them. | |
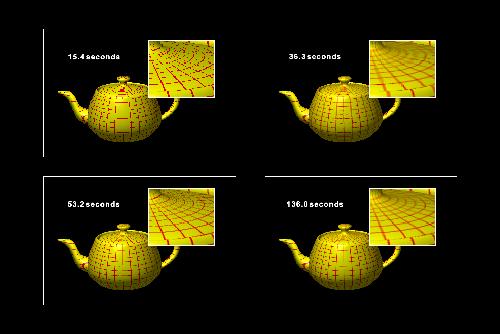
| 74: All images are rendered at 512x324. The upper left figure is not antialiased. The figure to its right was rendered with mipmapping. The textures are a little better. In the bottom row, the left image was supersampled at a rate of nine samples to one pixel. The final image benefited from 9:1 supersampling and mipmapping. | |
| 75-79: The final series of slides, courtesy of Evans and Sutherland, demonstrate mipmapping. The foreground in these images is texture mapped using the bigger mipmaps containing more detail, with the smaller mipmaps reserved for the background. In slide 75, compare cultivated fields in the foreground with those in the background. The technique is effective in simulating a wide variety of terrains, as can be seen in slides 76-78. Evans and Sutherland develop flight simulators to train pilots. These simulators project views of what the pilot would see if actually flying the plane (slide 79). The simulators change the views as the pilot flies the plane, and must react instaneously with new views in response to pilot commands. Mipmapping heightens the sense of reality by adding detail to the views. |
References
(Blinn, 1978) J. Blinn, Simulations of Wrinkled Surfaces. Computer Graphics 12(3) August 1978, 286-292.
(Blinn and Newell, 1976) J. Blinn and M. Newell, Texture and Reflection in Computer Generated Images. Communications of the ACM 19(10) October 1976, 542-546.
(Catmull, 1974) E. Catmull, A Subdivision Algorithm for Computer Display of Curved Surfaces. PhD thesis, Department of Computer Science, University of Utah, December 1974.
(Catmull, 1978) E. Catmull, A Hidden-Surface Algorithm with Anti-Aliasing. Computer Graphics 12 (3) August 1978, 6-10.
(Cook, 1984) R. Cook, Shade Trees. Computer Graphics 18 (3) July 1984 223-231.
(Crow, 1981) F. Crow, A Comparison of Antialiasing Techniques. IEEE Computer Graphics and Applications. 1 (1) January 1981, 40-49.
(Peachey, 1985) D. Peachey, Solid Texturing of Complex Surfaces. Computer Graphics 19 (3) July 1985, 279-286.
(Perlin, 1985) K. Perlin, An Image Synthesizer. Computer Graphics 19 (3) July 1985, 287-296.
(Williams, 1983) L. Williams, Pyradmial Parametrics. Computer Graphics 17 (3) July 1983, 1-11.
For more information on mapping techniques, see:
D. Ebert, F. K. Musgrave, D. Peachey, K. Perlin and S. Worley, Texturing and Modeling: A Procedural Approach. Academic Press, 1994.
J. Foley, A. vanDam, S. Feiner and J. Hughes, Computer Graphics: Principles and Practice. 2nd. ed. Addison-Wesley, 1990.
A. Watt and M. Watt, Advanced Animation and Rendering Techniques: Theory and Practice. Addison-Wesley, 1992.
Credits
The dining room seen in slides 6 and 22 was created by Steve van der Burg and rendered using POVRay. The teapots in slides 11 and 14 as well as the raytracing examples on slides 61-63 were done rendered using Craig Kolb’s Rayshade. David Ebert contributed slides 53 and 54. (Thanks, David!) The scene in slides 62 and 63 was created using Steven Chenney’s Sced. Kevin Ferguson developed the "pinwheel texture" to create the Grateful Teapot in slide 50. Pixar and Disney graciously donated the "Toy Story" images (slides 36, 55, and 64). Through Dave Tubbs, Evans and Sutherland generously donated slides 75-79.
All other slides were created with custom rendering software developed at DePaul University. Textures for the beachball and towel in the title slide came from the SIGGRAPH 97 beachball and committee "surfer" shirt.
Many people contributed time, expertise and creativity to this slide set. Thanks to Steve Cunningham for initial discussions that formed the core material for set and for his patience in reviewing many, many drafts. Alain Chesnais made many substantive and constructive comments and suggested the slides on parametric mapping and the visual comparison of lattice and gradient noise. Stephen Spencer, Judy Brown and Tom Rieke also made excellent suggestions for improvement to both the images and the text. Jackie White was most gracious in lending her time, despite adverse condition, to help create the title slide. An extra thanks you goes to Stephen Spencer who as Director for Publications supported the development of this set.
Thanks also to the 1997 Graphics students at DePaul, especially Olivier Buisard, who class-tested these images.
![]()
![]() Main Mapping Page
Main Mapping Page
![]() HyperGraph Home page.
HyperGraph Home page.
Last changed June 01, 1999, G. Scott Owen, owen@siggraph.org